

What is Pandas in Python? Pandas is an open-source Python library for working with datasets. It has functions for analyzing, cleaning, exploring, and manipulating data. Pandas allows us to analyze data, and gives us functions to help us find information and answer questions using statistical analysis.
We can use Pandas to select and merge data, and to clean messy datasets so they are easier to read and work with. Pandas is commonly used in data science, which is a branch of computer science that uses algorithms and processes to obtain knowledge and insights from data. The knowledge and insights obtained from data can be used to make decisions and implement solutions to problems.
As just one example, Netflix, the popular streaming service, uses Pandas as part of its data analysis toolkit. By analyzing viewer data, Netflix can recommend shows and movies tailored to each user's preferences. This personalized experience is one of the reasons why Netflix is so successful—and it's all made possible by tools like Pandas!
So today we'll guide you through an introduction tutorial to Pandas, and reveal some of its real-world applications. You and your child will learn more about loading and saving data, selecting data, viewing data, and some helpful functions.
Enroll your child in an award-winning live online class, designed by experts from MIT, Stanford, and Google, to learn everything you need to know about using Pandas. In a small group of up to just three students, they'll master data cleaning, data processing, and data analytics techniques - and even earn a certificate! Or explore free coding classes, including an introduction to Python.
How to Use the Pandas Python Library
Pandas programs can be run from any text editor, such as Replit, or from interactive coding notebooks such as Jupyter Notebook or Google Colab. Interactive coding notebooks provide the ability to execute code in a specific cell instead of executing an entire program file and an easy way to visualize datasets.
In this tutorial, we will use Google Colab to explore Pandas basics. You and your child can make a copy of the sample notebook to follow along with this tutorial.
Before we can use the Pandas library in our programs, we first need to import it. We import Pandas in the same way we import other libraries in Python programs.
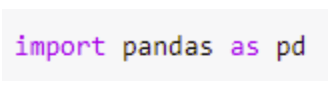
In this statement, pd is used as an alias to the Pandas library. We don't have to import Pandas using an alias, but it helps us write less code every time we need to call one of its functions.
Data is organized as Series and DataFrames in Pandas
A Series is a one-dimensional array that holds data, like a single column or row of data in a spreadsheet.
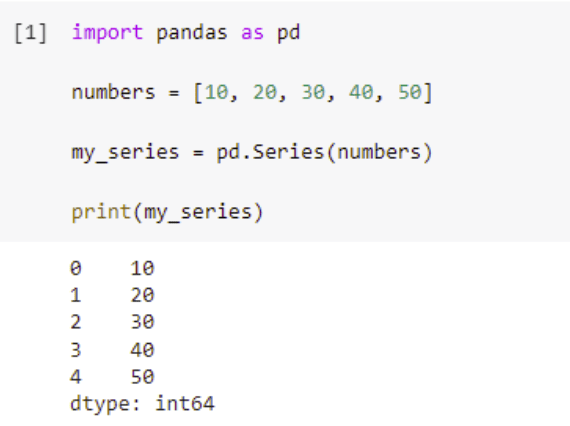
In this example, we create a Series called my_series that contains the values stored in the numbers list. When we run this code segment, we see two columns of values displayed. The first column represents the index position of the value in the Series, and the second column contains the value. Additionally, we see the data type of the values displayed.
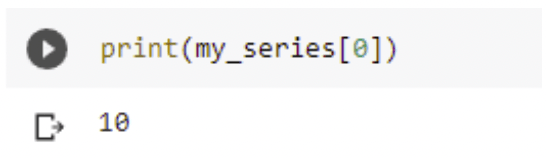
By default, each value is labeled with the index position in the Series. The first value is at index 0.
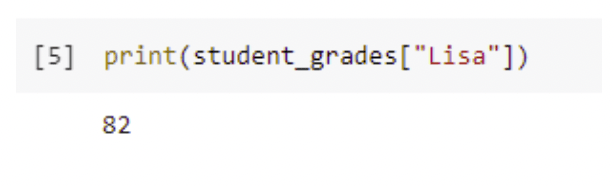
We can label each row with a name instead of using the index position as the label. We do this by adding the index argument when we create the Series.

When we create labels, we can access a value in the Series by referring to the label.
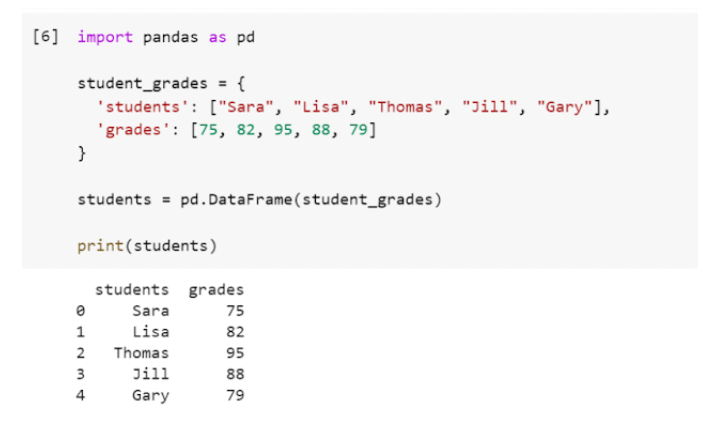
A DataFrame is a two-dimensional data structure that consists of rows and columns. While a Series is like a column in a table, a DataFrame is the entire table.
Loading and Saving Data with Pandas
Data scientists often use Pandas for data analysis by converting lists to a Pandas DataFrame as we saw in the previous example or by loading data from a file.
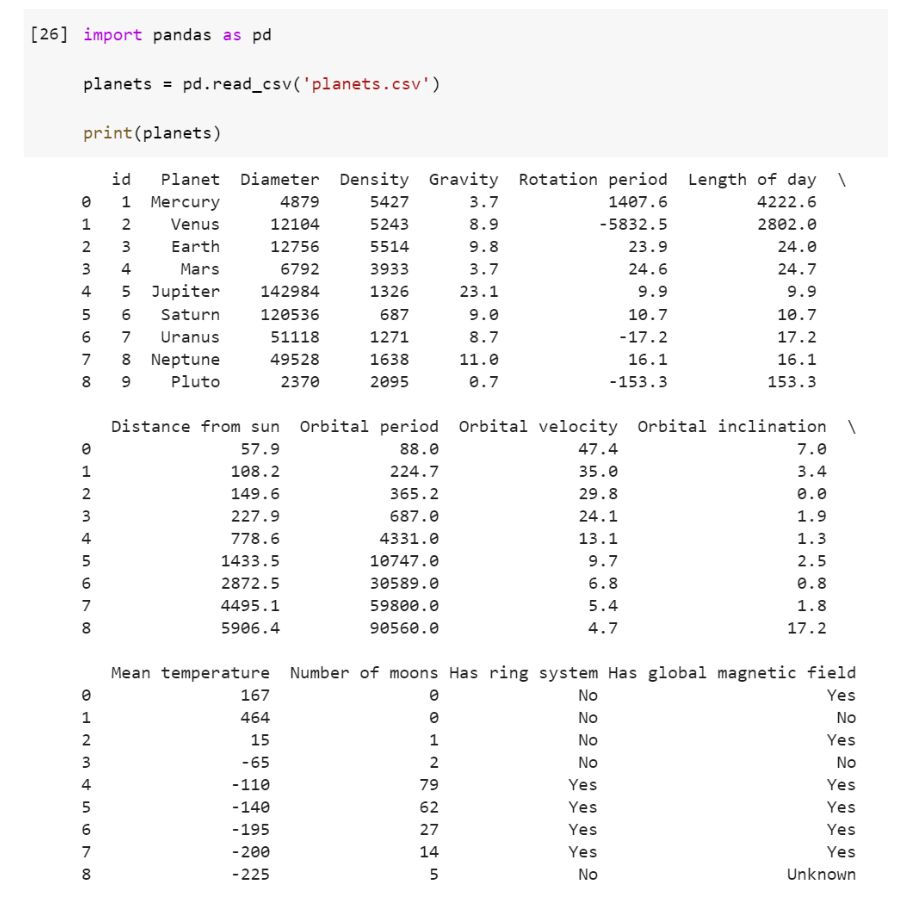
Let's try reading data from a file called planets.csv into a DataFrame. The read_csv() function takes a filename as its argument and returns a DataFrame containing the data from the file. In Google Colab, we can add datasets to work with by uploading them to the Files found on the left side of the notebook. In this example notebook, we have a planets.csv file located in our content folder. When we print this dataset, we see each column and their corresponding values displayed.
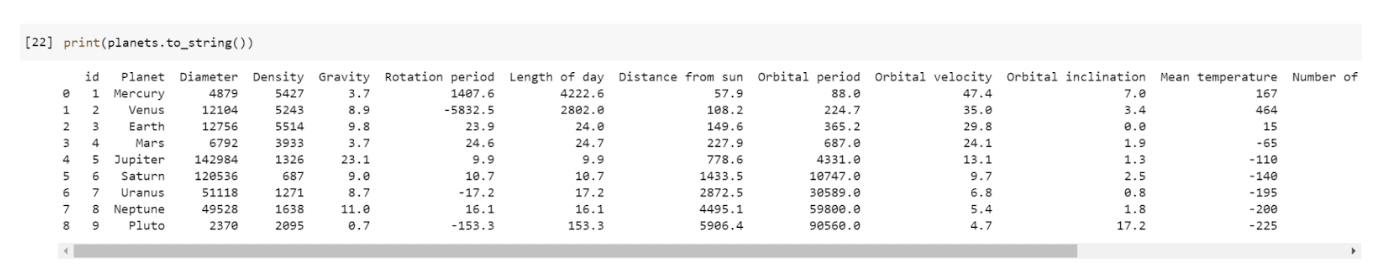
Notice that the way this is displayed is not very easy to follow. We can use the to_string() function to print our dataset as a table.
We can also save the DataFrame we are working with to a new file. Let's save this DataFrame to a new file called newplanets.csv. We will then see the new file in our content folder.
Selecting Data
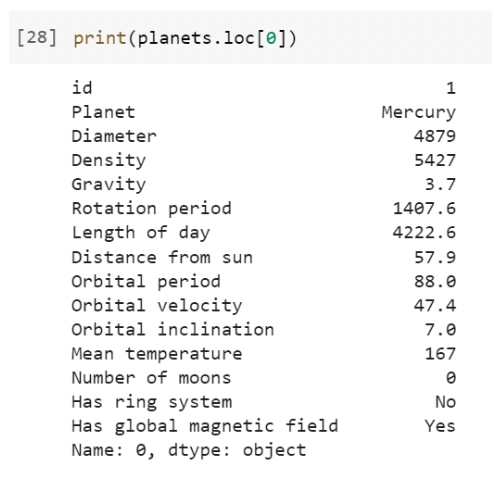
We can use the loc attribute in Pandas to obtain a Series from the DataFrame. Let's get the information for the first planet in our dataset.
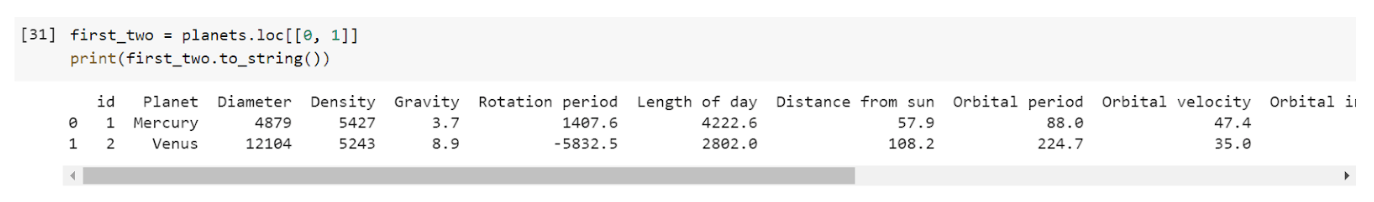
We can also obtain a new DataFrame that contains multiple rows from the original DataFrame. Let's get the information for the first two planets from the planets DataFrame.
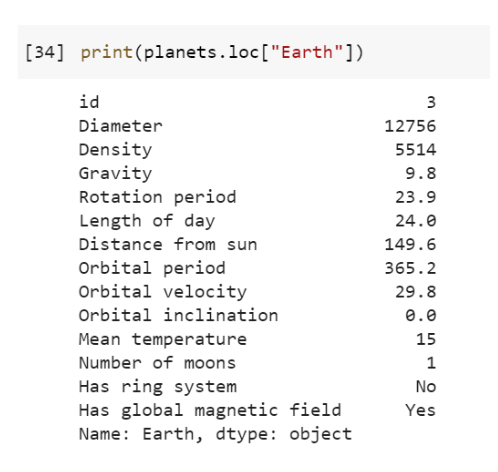
Just like we can label each value in a Series, we can label each row in a DataFrame using the set_index() function. The inplace=True argument updates the existing DataFrame. If this is False, then the existing DataFrame is not updated. Instead, a new DataFrame is returned.

Now we can use the named index in the loc attribute to obtain the data for a specific planet.
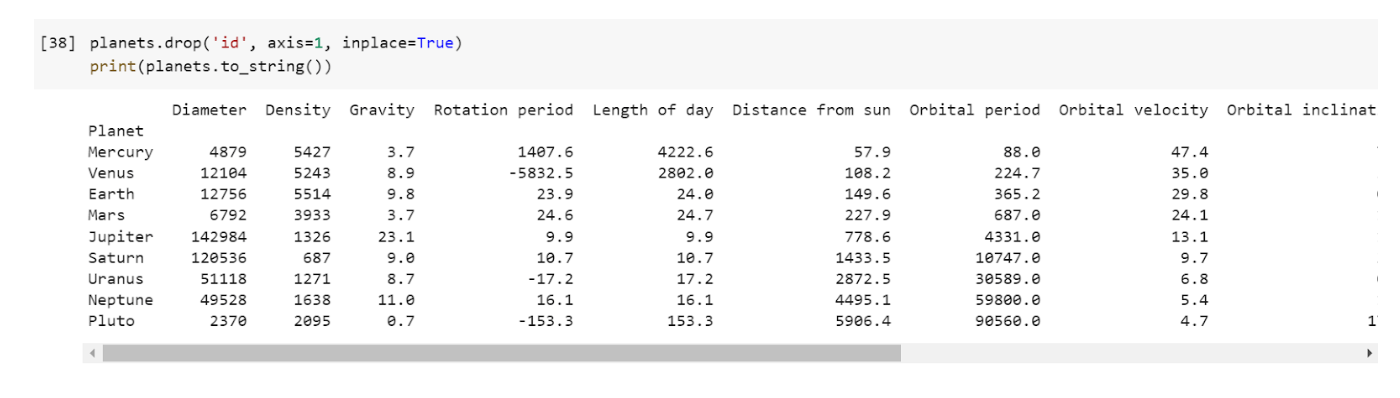
Notice that this column has an id column that we don't need. Pandas has a drop() function that allows us to remove columns from our dataset.
Let's drop the id column using this function. We will use the axis argument to specify whether to drop the label from the index (0) or the columns (1). We will also use the inplace=True argument to update the existing DataFrame.
Viewing and Inspecting Data in Pandas Python Library
Let's take a closer look at our data. Pandas has several functions available for obtaining information about a dataset.
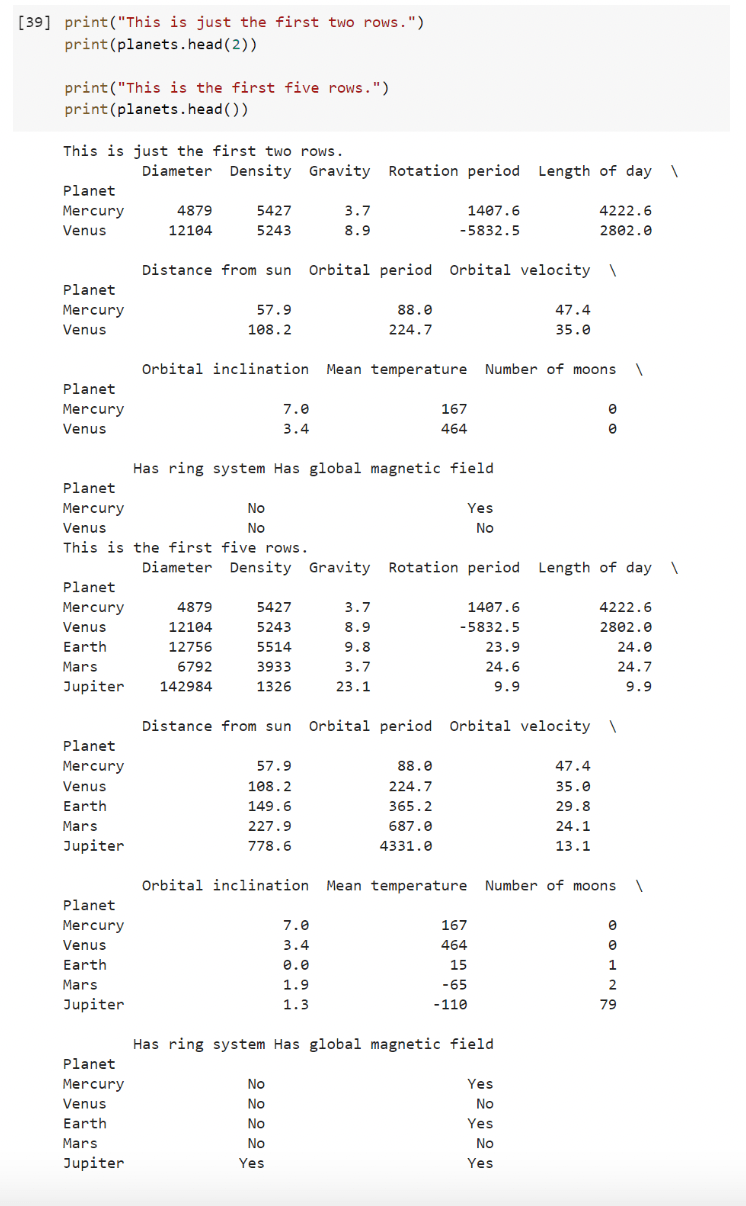
For example, the head() function can be used to obtain a specified number of rows. If the number of rows is not specified, the head() function returns only the first five rows.
The info() function gives us information about the dataset, such as the number of rows and columns, the data type of each column, and the number of non-null values in each column.
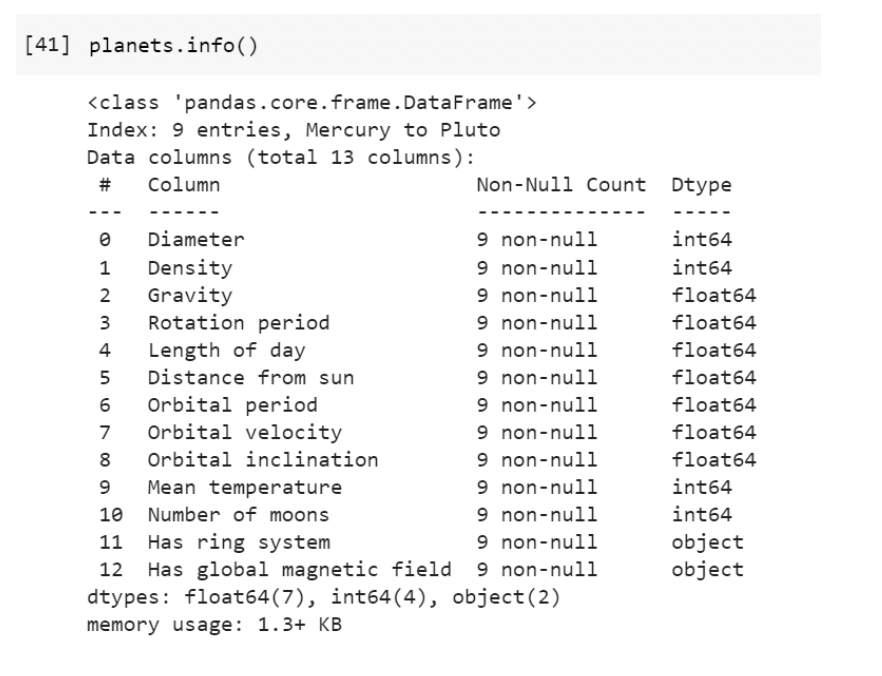
Empty, or null, values can cause problems when we are analyzing data. There are techniques and functions we can use in the Pandas library to clean the data by removing or replacing null values.
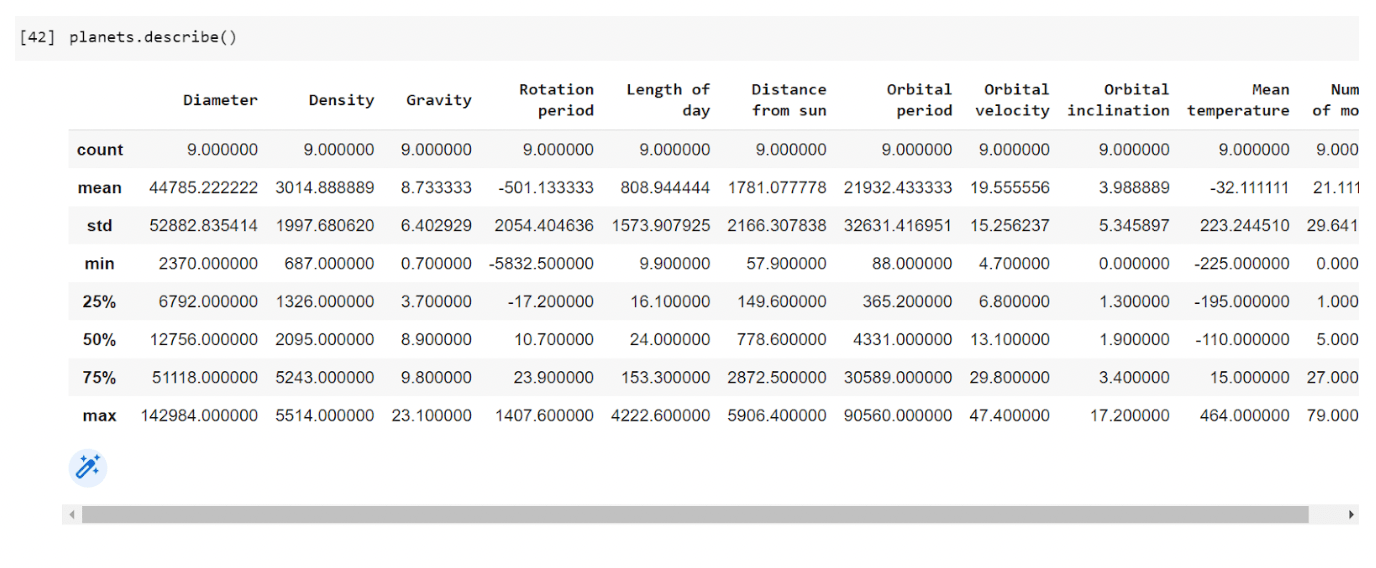
Another useful function in Pandas is the describe() function, which gives us summary statistics for numerical columns in our dataset.
In addition, Pandas has the following functions to obtain information about our dataset.
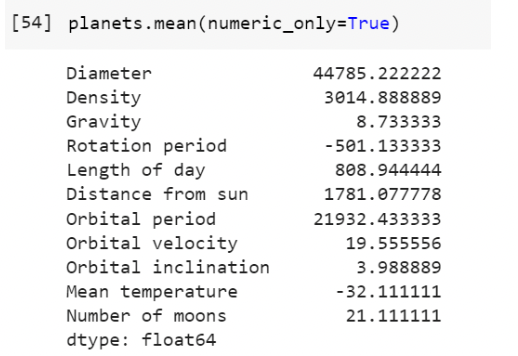
planets.mean() - returns the mean of all columns
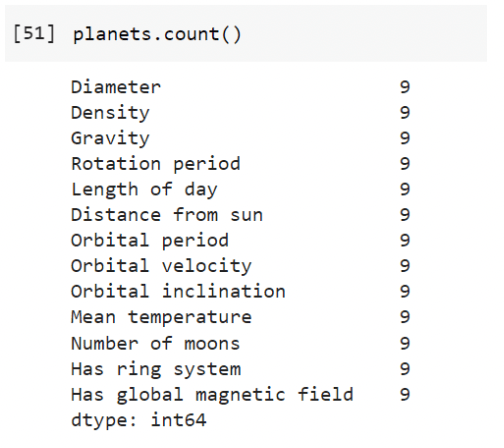
planets.count() - returns the number of non-null values in each column
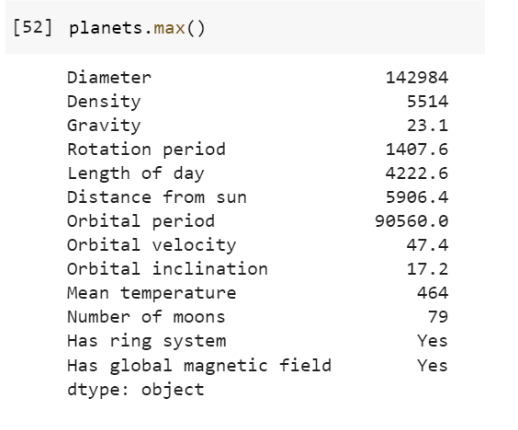
planets.max() - returns the highest value in each column
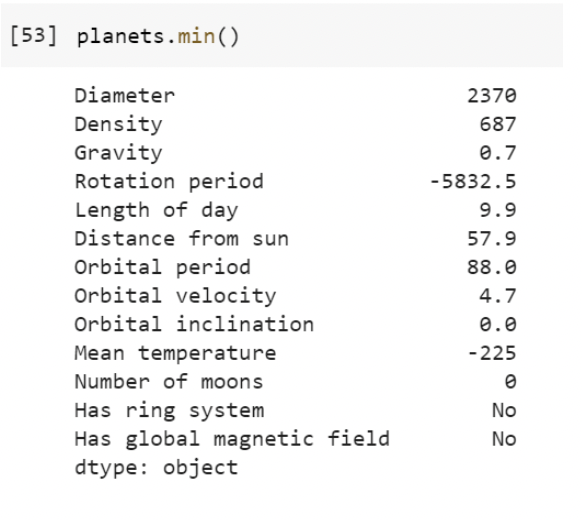
planets.min() - returns the lowest value in each column
Python Pandas Library Challenge: Analyze Movie Ratings with Pandas
To help your teen put their Pandas skills into practice, here's another fun and simple challenge: analyzing movie ratings! This challenge will give them a hands-on experience with real-world data. It’s a great way to see the power of Pandas in action.
Step 1: Choose Your Dataset
First, your teen will need a dataset. For this challenge, they can use the IMDb movie ratings dataset, which contains information about movies, their genres, and user ratings.
Step 2: Load the Dataset
Next, they’ll need to load the dataset into their Python environment. Encourage them to use Google Colab again for this exercise. Here’s how they can load the data:
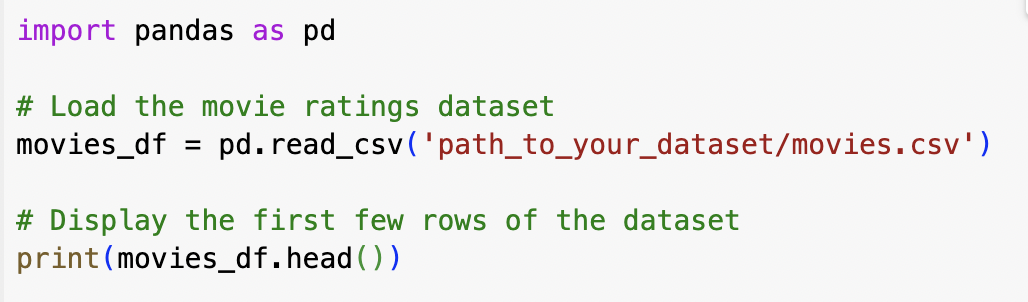
Result: If the dataset is structured properly, you’ll see the first five rows printed, which might include columns like "title," "genre," "rating," and other relevant data about movies.
Pandas Function Used: pd.read_csv() and movies_df.head(): The pd.read_csv() function reads a CSV (Comma-Separated Values) file into a Pandas DataFrame, which is a table-like data structure. The DataFrame is stored in the variable movies_df. This allows for easy manipulation and analysis of the data. The head() function displays the first five rows of the DataFrame. This is useful for quickly inspecting the structure and contents of the dataset to ensure it has been loaded correctly.
Step 3: Clean the Data
Once the data is loaded, it’s important to clean it by removing any null values or duplicates. This is a crucial step in data analysis:
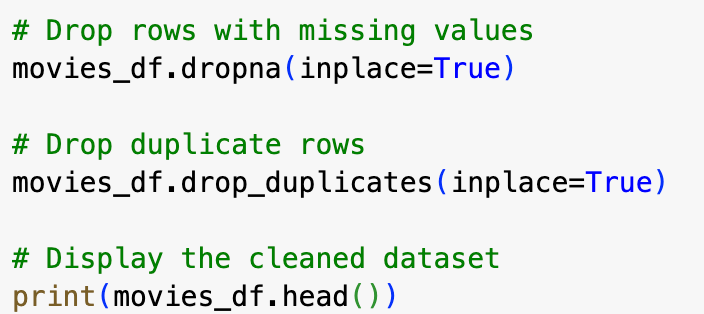
Result: You’ll see the first five rows of the dataset again, but this time without any missing values or duplicates.
Pandas Functions Used: movies_df.dropna( ) and movies_df.dropduplicates( ): dropna(inplace=True) removes any rows from the DataFrame that contain missing values (NaNs). drop_duplicates(inplace=True) removes any duplicate rows from the DataFrame. Both functions modify the DataFrame in place, meaning they directly alter the existing movies_df without needing to reassign it to a new variable.
Step 4: Analyze Movie Ratings
Now, it’s time to dive into the data! They can start by calculating the average rating of all movies:
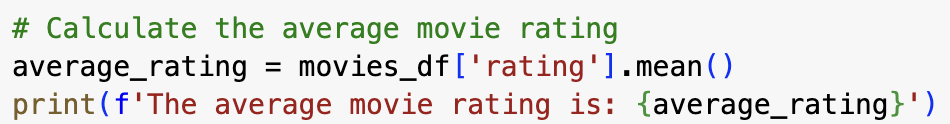
Result: You’ll get a printed statement like: The average move rating is: 7.5. (The exact number depends on your dataset).
Pandas Function Used: movies_df['rating].mean(): The mean() function calculates the average of the values in the "rating" column. This gives a quick statistical summary of the movie ratings in the dataset.
Step 5: Explore Further
Encourage them to explore more! They can find the highest-rated movie, analyze ratings by genre, or even visualize the data using graphs. For example:

Result: You’ll get a printed statement like: The highest-rated movie is: Mary Poppins with a rating of 9.3. (The exact movie and rating depend on your dataset).
Pandas Functions Used: movies_df['rating'].idxmax() and movies_df.loc[]: idxmax() finds the index of the maximum value in the "rating" column, which corresponds to the highest-rated movie. loc[] is then used to access the row in the DataFrame at this index, allowing you to extract and display specific information about the highest-rated movie, such as its title and rating.
Real-World Applications of Python Pandas Library
Pandas isn't just another tool in the coding toolkit—it's a powerful library with real-world applications that can open doors to exciting career paths for your teen. Understanding how Pandas is used across various industries can help you see its value and inspire your teen to explore the possibilities.
1. Finance
In the fast-paced world of finance, data is king. Pandas is widely used to analyze stock market trends, helping financial analysts make informed decisions. For example, a financial analyst might use Pandas to track historical stock prices, calculate moving averages, or identify patterns that could indicate future market movements.
2. Healthcare
The healthcare industry relies on vast amounts of data to track patient outcomes, manage hospital resources, and even predict disease outbreaks. With Pandas, data scientists can clean and organize medical datasets, making it easier to extract meaningful insights. For instance, a hospital might use Pandas to analyze patient data to improve treatment plans or to monitor the spread of infectious diseases.
3. Sports Analytics
Sports teams and organizations are increasingly turning to data to gain a competitive edge. Pandas plays a key role in sports analytics, allowing teams to analyze player performance, track in-game statistics, and make data-driven decisions. Imagine your teen using Pandas to analyze their favorite team's performance or to predict the outcome of a big game!
4. E-Commerce and Marketing
Online stores generate massive amounts of data every day, from customer transactions to website traffic. Pandas helps e-commerce companies manage and analyze this data to optimize their operations. For example, an e-commerce platform might use Pandas to analyze customer purchase patterns, manage inventory levels, or personalize marketing strategies.
Use the Pandas Python Library
This introduction to Pandas is only the beginning of what you can do with a dataset! You can combine your knowledge of Python conditionals and loops to perform more complex analysis of the data, and there are more functions in the Pandas library you can use to find information and perform calculations. As you work with larger datasets, you will also encounter scenarios where you will need to perform data cleaning, which is an important part of data science. Additionally, data scientists often create visualizations of data to obtain a better understanding of the information the data is portraying. You can learn more about how you can use Pandas for data analytics in a fun live online Data Analytics Python class!
Written by Jamila Cocchiola who has always been fascinated with technology and its impact on the world. The technologies that emerged while she was in high school showed her all the ways software could be used to connect people, so she learned how to code so she could make her own! She went on to make a career out of developing software and apps before deciding to become a teacher to help students see the importance, benefits, and fun of computer science.